Did you know that nearly 80% of long-term stock market success comes from efficient reinvestment of capital? Many investors only look at share prices. But, the real wealth creator often lies in financial statements. Knowing how to measure this efficiency is key for building a strong portfolio.
This guide is a detailed resource for US investors wanting to grasp the basics of return on equity. We dive into how this key metric assesses management efficiency and long-term company health. By understanding this, you can spot if a business is effectively using shareholder capital for growth.
Efficiency is crucial for a good investment. When analyzing a company, you want to see your money working as hard as the team. Learning to read this data helps you weed out poor performers and find businesses with lasting advantages.
Key Takeaways
- Return on equity measures how well a company uses shareholder capital to make profits.
- It’s a key sign of management skill and financial health.
- Compare this metric with peers in the same industry for a fair view.
- High figures might show strong performance, but can also hide debt issues.
- We use it to find companies that add value, not just spend cash.
What is ROE and Why is it Important?
Knowing how well a business makes money from shareholder funds is key for investors. We use certain tools to see if a company is really doing well. By looking at the right data, we can choose where to invest our money wisely.
Return on Equity is a powerful tool in our arsenal. This profitability metric shows us how a company uses shareholder money to grow.
Definition of Return on Equity
ROE measures a company’s net income compared to shareholder equity. It shows how much profit a company makes for every dollar invested.
When we do financial analysis, we seek companies with high returns. A high ROE means management is good at using earnings to grow the business, not just sitting on cash.
Understanding Its Significance in Investing
For long-term investors, ROE is a crucial key performance indicator. It shows a company’s financial performance over time. By tracking this, we find companies that stay ahead in their markets.
This tool is also key for comparing similar companies in the same field. Since different industries need different amounts of money, ROE helps us make fair comparisons. It helps us pick the best stocks for our portfolios without confusion.
Calculating ROE: A Step-by-Step Guide
Calculating the return on equity shows how well a business uses its capital. To do this, we need to look at the income statement and balance sheet. This helps us see if a company is making enough value for its shareholders.
The Formula You Need to Know
The formula for profitability metric is simple. You just divide net income by shareholders’ equity. But, using average equity gives more accurate results.
Average equity smooths out yearly changes. This key performance indicator is calculated like this:
Example Calculation for Clarity
Let’s use a retail company example. The company made $500,000 in net income. At the start, equity was $2,000,000, and by the end, it was $3,000,000.
To find average equity, we add the start and end balances and divide by two. So, the average equity is $2,500,000. Then, we divide the net income of $500,000 by this average.
The ROE is 0.20, or 20%. This means the company makes twenty cents in profit for every dollar of equity. By using this method, you can compare different businesses’ efficiency.
ROE vs. Other Financial Ratios
It’s key to know how ROE compares to other financial signs. The return on equity is a crucial profitability metric. Yet, it’s just one part of the story. A detailed financial analysis helps us see real success versus just numbers.
Comparison with Return on Assets (ROA)
Return on Assets (ROA) shows how well a company uses its assets to earn money. Unlike ROE, ROA looks at both debt and equity. This makes ROA a better sign of asset utilization, no matter the funding.
A high ROE but low ROA might mean a company uses a lot of debt. We need to check both to see if the management is smart or taking big risks. A balanced look helps us spot companies that seem profitable but aren’t.
How ROE Relates to Profit Margin
The link between ROE and profit margins is key to understanding business quality. Profit margin shows how much profit comes from each dollar sold. When we mix this with asset turnover, we get a clearer view of why a company has a certain ROE.
A company can get a high return on equity in different ways. It could have high profit margins, high asset turnover, or use a lot of debt. Operational efficiency is usually the best way to grow for the long term. By looking at these parts, we can tell if a company’s success is real or just a short-term trick.
Understanding ROE Trends Over Time
Looking at return on equity over years shows how well a company is managed. Just one year’s data can be misleading about a company’s financial performance.
By examining several years, we see which companies are truly growing. This helps investors build strong portfolios.
How to Analyze ROE Trends
To analyze trends, plot data on a chart for at least five years. This shows if changes are real or just random.
Also, compare trends with industry peers. If a company’s ROE goes up while others stay the same, it might have a competitive advantage.
“The long-term success of a business is rarely found in a single quarter; it is found in the persistent ability to generate returns on the capital entrusted to it.”
The Importance of Consistency in ROE
Consistency shows a company is well-managed and values its shareholders. A steady or rising ROE means management is good at growing the business.
But, big changes in ROE might mean problems, like unstable profits or too much debt. Here’s how different trends affect our view of a company.
| Company Profile | ROE Trend (5 Years) | Investor Outlook |
|---|---|---|
| Stable Performer | 15% – 17% (Steady) | High Confidence |
| Growth Star | 10% -> 20% (Rising) | Strong Potential |
| Volatile Entity | 5% -> 25% -> 2% | High Risk |
We look for companies with predictable and sustainable results. This way, we avoid short-term market noise and focus on the business’s real health.
Industry Comparisons: ROE Across Sectors
Every business is different, and so is their financial health. The return on equity (ROE) is a key metric, but it means different things in different industries. For example, comparing a tech company to a utility provider is not fair.
Each industry has its own way of making money. To really understand a company, we need to compare it to others in the same field. This way, we can see how well it’s doing, not just based on its industry.
High-Performing Industries and Their ROEs
Some industries make more money because they don’t need a lot of physical assets. Tech and software companies, for example, can grow fast without big investments in buildings or stock.
These industries often have high profit margins and grow quickly. They usually have:
- Low costs for starting up.
- Strong protection of their ideas.
- Easy growth with digital products.
Identifying Underperforming Sectors
On the other hand, some industries face big challenges that lower their return on equity. Industries like utilities, telecom, and heavy manufacturing need a lot of money for equipment and buildings.
This high cost can make their ROE look worse than others. But, a low ROE in these areas doesn’t always mean bad management. It often shows the high costs and big assets needed to operate.
When looking at these sectors, we should consider:
- Steady cash flow over time.
- Good management of debt.
- Keeping stable profits despite high costs.
Understanding these differences helps us use return on equity better in our investment research. Always compare a company to its peers to get a fair view of its ROE.
The Impact of Debt on ROE
Many investors miss the dangers debt brings to profit ratios. A high ROE might look good, but it can hide financial trouble. We need to check if these returns come from smart business moves or just from borrowing a lot.

How Leverage Affects Return on Equity
When a company borrows money, it uses less of its own money for assets. This is shown by the equity multiplier. It makes the return on equity look better by changing the numbers.
This trick makes companies seem to grow more than they really do. But, it’s not without risks. It’s important to know how default risk affects your money when a company borrows too much.
Evaluating Debt in Relation to ROE
To understand better, compare the ROE to the debt-to-equity ratio. A company with high returns and low debt is usually healthier. Consistency in performance is a better sign of health than a quick rise from debt.
Be careful of companies that use the equity multiplier to hide falling profits. By removing debt’s impact, we see if the business is really making money. Choose companies that grow naturally, not those that impress with debt.
Common Misunderstandings About ROE
Using return on equity alone can hide important details in your financial analysis. This metric is well-known but doesn’t show everything about a company’s health. It’s crucial to look deeper to avoid common mistakes.
Debunking Myths Related to ROE
Many think a higher ROE is always good. But, a company might get a high ROE by taking on too much debt. This makes the equity seem smaller than it is, hiding real problems.
Another myth is about companies with negative equity. If a company has lost money or taken on too much debt, its equity can turn negative. This makes the return on equity calculation tricky or even wrong. Investors should be very careful with these numbers.
The Risks of Misinterpreting ROE
Using ROE alone can be risky because it doesn’t show the quality of earnings. A company might have a high ROE from selling assets, not from regular growth. Always check these numbers with other tools to make sure they’re accurate.
To get a full picture of a company’s health, look at different metrics. The table below shows why one ratio isn’t enough for good financial analysis.
| Metric | What It Measures | Potential Limitation |
|---|---|---|
| ROE | Profitability relative to equity | Can be inflated by high debt |
| ROA | Efficiency of total assets | Ignores capital structure |
| Profit Margin | Operational efficiency | Does not account for leverage |
| Debt-to-Equity | Financial risk | Does not measure profitability |
By using these metrics together, you get a better understanding of a business. Never make investment decisions based on just one number. Always do a detailed review before investing.
Using ROE in Investment Decisions
Adding ROE to your investment strategy changes how you pick stocks. It lets you see beyond just prices and into a company’s true health. This way, you focus on businesses that really add value for their owners.
How to Incorporate ROE into Your Strategy
A winning strategy finds companies with smart management. We check if a company’s return on equity stays steady or grows over time. This shows that leaders are good at using money to grow the business.
Seeing ROE as a sign of operational excellence is key. Companies that stay profitable without too much debt are top picks for long-term growth. By choosing these, we invest in teams that have shown they can succeed.
ROE as a Screening Tool for Stocks
Using financial analysis to sift through stocks is crucial for investors. We often use ROE to weed out companies that don’t meet basic profit standards. This narrows our search to a list of top-notch investment chances.
Setting a minimum return on equity helps us avoid companies that can’t make money from their assets. This rigorous screening protects us from bad investments. By focusing on key performance indicators, we build a portfolio of financially strong and well-managed companies.
The Role of Retained Earnings in ROE
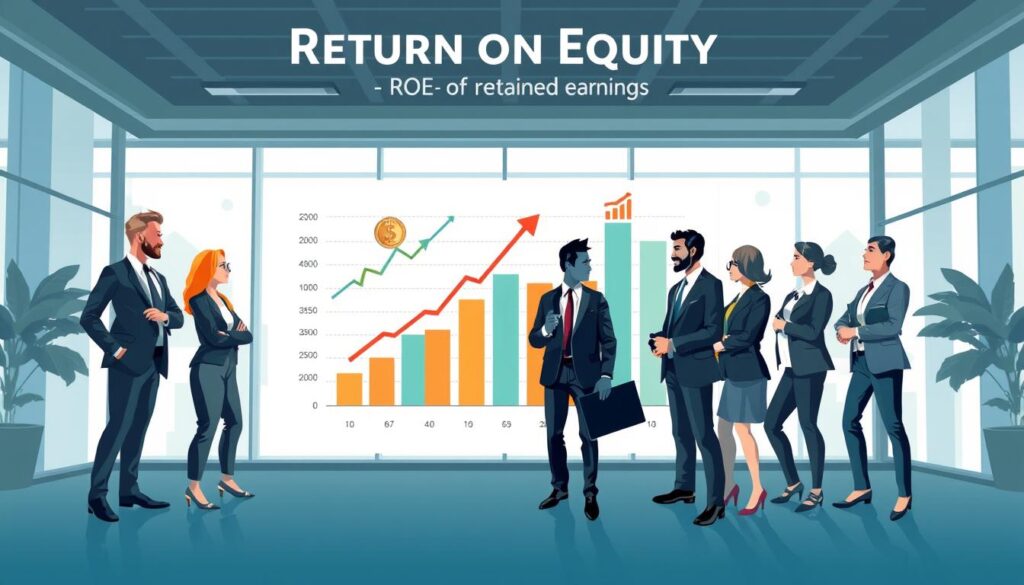
Management decisions on profit retention are crucial for shareholder value. Companies can choose to give cash to shareholders or put it back into the business. This choice is key for investors looking at long-term growth.
Understanding Earnings Retention Strategies
Companies often keep earnings to fund research, expand, or buy new tech. This avoids costly external financing and keeps ownership strong. Strategic reinvestment shows management sees big growth opportunities.
On the other hand, some companies pay out most of their earnings. This means they think they’ve reached a growth limit. Investors need to check if the company is using its capital wisely.
The Relationship Between Retained Earnings and ROE
Retained earnings and return on equity are closely linked. When a company keeps earnings, its equity grows. If it uses that capital well, profits will rise, keeping or boosting ROE.
But, if a company keeps earnings but doesn’t make good use of it, ROE will drop. Financial analysis must look beyond just profit numbers. It’s about seeing if management can turn retained cash into growth.
A high ROE often comes from smart reinvestment. By investing in high-margin projects, a company gets stronger. Investors who watch these trends understand how a company builds value over time.
ROE and Shareholder Value
The link between how a company uses its money and its growth is key in finance today. Looking at a company’s profits isn’t enough. We need to see how it creates shareholder value. How a company uses extra cash can shape its future.
How ROE Relates to Dividends and Share Buybacks
Companies often give dividends or buy back shares to thank investors. These actions are usually good, but they can also change return on equity in tricky ways. Buying back shares can make ROE look better without really boosting profits.
It’s important to watch out for ROE increases that come from tricks, not real growth. If a company uses a lot of debt for buybacks, it might look good short-term but hurt its finances long-term. True growth comes from good operations, not just numbers.
“The most important thing to do if you find yourself in a hole is to stop digging.”
Evaluating Shareholder Returns
To really understand shareholder value, we need to tell real growth from just moving money around. Companies that put profits into projects that make more money usually do better than those that just buy back shares. We should look at how steady earnings are, too.
The table below shows the difference between real growth and tricks that affect ROE.
| Strategy | Impact on ROE | Value Creation |
|---|---|---|
| Organic Reinvestment | Sustainable Increase | High |
| Share Buybacks | Artificial Increase | Moderate |
| Debt-Funded Dividends | Short-term Boost | Low |
In the end, shareholder value is safest when companies balance giving back to investors with investing for the future. By checking these trends, we can spot companies that focus on lasting growth, not just quick fixes.
Adjusted ROE: A More Accurate Measurement
Standard ROE gives a basic view, but savvy investors dig deeper. They want to know the real story behind a company’s success. Adjusted ROE shows how well a company values its shareholders.
Why Adjust ROE?
Adjusting return on equity helps break it down into key parts. The DuPont formula does this by focusing on profit margin, asset utilization, and equity multiplier.
This way, we can pinpoint where a company shines or stumbles. For example, a high return on equity might seem great, but it could be due to too much debt, not efficiency. Adjusting ROE lets us see which companies are truly productive, not just leveraged.
Situations for Adjusted ROE Calculation
This advanced look is key when comparing companies with different financing. A firm with lots of debt versus one with more equity might look different at first glance. The equity multiplier helps level the playing field, showing which team is better at returns.
Also, we adjust ROE for companies going through big changes. If a company is working hard to use its assets better, adjusted figures show if it’s working. This is before the results show up in net income.
| Metric Component | What It Measures | Strategic Insight |
|---|---|---|
| Profit Margin | Operational Efficiency | Pricing power and cost control |
| Asset Utilization | Efficiency of Assets | How well resources generate sales |
| Equity Multiplier | Financial Leverage | Risk exposure from debt levels |
Final Thoughts: Making ROE Work for You
Learning about financial analysis takes time and attention to detail. It’s key to understand how businesses make money from their own capital. This knowledge is crucial for smart investing.
Core Lessons for Your Portfolio
The return on equity metric is a key tool for the stock market. It helps you see how companies like Apple or Microsoft use their resources. This insight lets you spot the winners from the losers.
Remember, one number doesn’t tell everything. You need to look at a company’s overall financial health. Comparing these numbers to others in the industry helps you make better choices.
Taking the Next Step
Building wealth over time begins with regular practice. Start by checking your favorite stocks against historical averages. This skill helps you find companies that focus on long-term value.
Keep improving your strategy as you learn more. Use these tools to create a portfolio that fits your goals and risk level. Your dedication to learning these metrics will help you succeed in the US market.